ESAB India full analysis || Esab India share price || ESAB India
ESAB India: A Leading Supplier of Welding and Cutting Products in India
Esab India Limited :
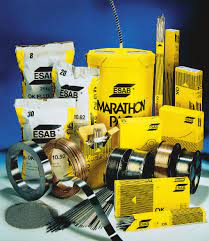
ESAB India is a subsidiary of the ESAB Group and is ultimately owned by the Colfax Corporation of the United States. It is a leading supplier of welding and cutting products in India and offers a wide range of products including welding consumables, arc welding equipment, plasma cutting automation, gas equipment, welding automation and robotics, digital solutions, and PPE and accessories. The company has a strong distribution network of approximately 200 distributors across India, with 80% of its sales coming from distributors and the rest from direct sales to institutional clients. The company operates four manufacturing facilities in Chennai, Kolkata, Nagpur, and Chengalput in Tamil Nadu.
In the fiscal year of 2021, the majority of the company’s revenue came from welding consumables at 71%, while welding equipment accounted for 29%. In the fiscal year 2022, the company’s revenue was primarily generated from manufactured goods at 76%, traded goods at 22%, and engineering, support, and consulting services at 2%.
ESAB India has a significant export presence, exporting to various countries such as Qatar, Bangladesh, Vietnam, Dubai, Indonesia, Nepal, Sri Lanka, Malaysia, Australia, Thailand, Singapore, South Africa, China, Uzbekistan, Hong Kong, and others. In the fiscal year 2021, exports accounted for approximately 9% of the company’s revenue.
The company’s parent company, ESAB Holdings Ltd (UK), charges trademark license fees for the use of trademarks, and ESAB India paid 20 crores in the fiscal year 2022 for the use of these trademarks. The company also has significant purchases and sales of goods and services from and to various group companies and provides support services activities out of India in the areas of R&D and shared services for other subsidiaries of Colfax around the world.
ESAB India’s history is marked by several key acquisitions. The company started its operations by acquiring the welding business of Peico Electronics & Electricals Ltd (now Philips India) in 1987 and continued to expand by acquiring the welding business of Indian Oxygen in 1991 and Flotech Welding & Cutting Systems Ltd in 1992. The company also merged Maharashtra Weldaids Ltd with itself in 1994.
The ESAB Group, of which ESAB India is a part, was established in 1904 and is engaged in the production of welding consumables and equipment. The group has a presence in 80 countries, with approximately 8,700 employees and 26 manufacturing facilities across four continents.
In April 2022, Colfax Corporation incorporated a WOS in the name of ESAB Corporation, Delaware, USA, and made it the holding company of ESAB Holdings (Principal Shareholder of ESAB India). Further, Colfax sold 90% of the equity shares in ESAB Corporation, reducing its stake to 10%.
In conclusion, ESAB India is a leading supplier of welding and cutting products in India, offering a wide range of products and services to its customers. With a strong distribution network and several key acquisitions, the company has established itself as a major player in the industry. The company’s parent company, the ESAB Group, is a well-established entity with a global presence and a rich history in the production of welding consumables and equipment. As the company continues to grow and expand, it is poised to make a significant impact on the welding and cutting industry in India and around the world.
Esab India share price :
Esab India Ltd, an Indian multinational company, is one of the leading manufacturers of welding and cutting equipment. The company has a market capitalization of ₹ 5,967 crore and its current stock price is ₹ 3,877. It has a high of ₹ 4,338 and a low of ₹ 2,641. The stock P/E ratio is 51.8 and the book value is ₹ 176. Esab India Ltd has a dividend yield of 1.55% and a return on equity (ROE) of 33.2%. The return on capital employed (ROCE) is 44.5%. The face value of the stock is ₹ 10. With a strong focus on product quality and customer satisfaction, Esab India Ltd is well-positioned to continue its growth trajectory in the future.
Quarterly Results :
| Mar-21 | Jun-21 | Sep-21 | Dec-21 | Mar-22 | Jun-22 | Sep-22 | Dec-22 | |
| Sales | 207 | 181 | 221 | 227 | 265 | 243 | 277 | 267 |
| Expenses | 178 | 153 | 189 | 199 | 234 | 208 | 233 | 219 |
| Operating Profit | 29 | 28 | 32 | 27 | 30 | 36 | 45 | 48 |
| Profit before tax | 27 | 27 | 32 | 26 | 29 | 34 | 43 | 49 |
| Net Profit | 20 | 20 | 24 | 19 | 21 | 26 | 32 | 36 |
| EPS in Rs | 12.81 | 13.22 | 15.37 | 12.32 | 13.86 | 16.63 | 20.73 | 23.59 |
Profit & Loss :
| Financial Year | Mar-16 | Mar-17 | Mar-18 | Mar-19 | Mar-20 | Mar-21 | Mar-22 | TTM |
| Sales | 451 | 466 | 543 | 672 | 698 | 681 | 893 | 1,053 |
| Expenses | 406 | 422 | 491 | 593 | 601 | 598 | 775 | 893 |
| Operating Profit | 45 | 44 | 52 | 79 | 97 | 83 | 117 | 159 |
| Profit before tax | 41 | 38 | 53 | 84 | 97 | 81 | 114 | 154 |
| Net Profit | 28 | 27 | 37 | 58 | 71 | 59 | 84 | 115 |
| EPS in Rs | 18.41 | 17.45 | 24.13 | 37.41 | 46.39 | 38.52 | 54.77 | 74.81 |
| Dividend Payout % | 5% | 6% | 4% | 241% | 151% | 114% | 110% |
Balance Sheet :
| Financial Year | Mar-16 | Mar-17 | Mar-18 | Mar-19 | Mar-20 | Mar-21 | Mar-22 | Sep-22 |
| Share Capital | 15 | 15 | 15 | 15 | 15 | 15 | 15 | 15 |
| Reserves | 300 | 327 | 363 | 251 | 322 | 244 | 229 | 256 |
| Borrowings | 0 | 1 | 0 | 0 | 5 | 3 | 3 | 2 |
| Total Liabilities | 386 | 428 | 480 | 379 | 458 | 388 | 436 | 456 |
| Fixed Assets | 78 | 76 | 80 | 83 | 86 | 90 | 90 | 86 |
| CWIP | 5 | 7 | 8 | 3 | 7 | 3 | 3 | 9 |
| Investments | 120 | 147 | 125 | 30 | 70 | 41 | 31 | 25 |
| Other Assets | 183 | 198 | 269 | 262 | 295 | 255 | 312 | 336 |
| Total Assets | 386 | 428 | 480 | 379 | 458 | 388 | 436 | 456 |
Shareholding Pattern :
| Quarter | Mar-21 | Jun-21 | Sep-21 | Dec-21 | Mar-22 | Jun-22 | Sep-22 | Dec-22 |
| Promoters | 73.72 | 73.72 | 73.72 | 73.72 | 73.72 | 73.72 | 73.72 | 73.72 |
| FIIs | 3.84 | 3.79 | 0.09 | 0.15 | 0.21 | 0.64 | 0.63 | 0.73 |
| DIIs | 10.06 | 9.99 | 13.53 | 13.69 | 13.68 | 13.51 | 13.48 | 13.26 |
| Government | 0.4 | 0.4 | 0.4 | 0.42 | 0.42 | 0.42 | 0 | 0 |
| Public | 11.98 | 12.1 | 12.26 | 12.01 | 11.97 | 11.7 | 12.15 | 12.27 |
“DISCLAIMER: This article is only for educational and knowledge purposes Before taking any decision plz once consult with your financial advisor or do your own research. The website would not be responsible for any financial gain as well as for losses. I am not SEBI registered.“


